 1
 2
 3
 4
 5
 6
 7
 8
 9
10
11
12
13
14
15
16
17
18
19
20
21
22
23
24
25
26
27
28
29
30
31
32
33
34
35
36
37
38
39
40
41
42
43
44
45
46
47
48
49
50
51
52
53
54
55
|
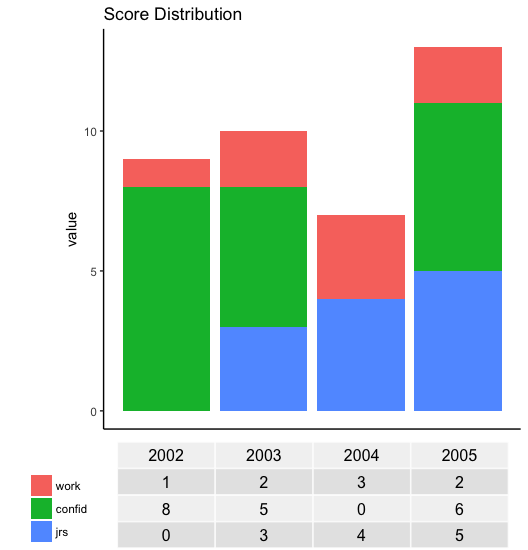
library(grid)
library(gridExtra)
library(ggplot2)
library(reshape)

# demo data
df <-
  structure(
    list(
      year = 2002:2005,
      work = c(1L, 2L, 3L, 2L),
      confid = c(8L,
                 5L, 0L, 6L),
      jrs = c(0L, 3L, 4L, 5L)
    ),
    .Names = c("year", "work",
               "confid", "jrs"),
    class = "data.frame",
    row.names = c(NA,-4L)
  )

md <- melt(df, id=(c("year")))

# Function to extract legend
# https://stackoverflow.com/a/13650878/496488
g_legend <- function(a.gplot){
  tmp <- ggplot_gtable(ggplot_build(a.gplot))
  leg <- which(sapply(tmp$grobs, function(x) x$name) == "guide-box")
  legend <- tmp$grobs[[leg]]
  return(legend)}

p = ggplot(data=md, aes(x=year, y=value, fill=variable) ) +
  geom_bar(stat="identity")+
  #theme(axis.text.x=element_text(angle=90, vjust=0.5, hjust=0.5))+
  ggtitle("Score Distribution") +
  labs(fill="")

# Extract the legend as a separate grob
leg = g_legend(p)

# Create a table grob
tab = t(df)
tab = tableGrob(tab, rows=NULL)
tab$widths <- unit(rep(1/ncol(tab), ncol(tab)), "npc")

# Lay out plot, legend, and table grob
grid.arrange(arrangeGrob(nullGrob(),
                         p + guides(fill=FALSE) +
                           theme(axis.text.x=element_blank(),
                                 axis.title.x=element_blank(),
                                 axis.ticks.x=element_blank()),
                         widths=c(1,8)),
             arrangeGrob(arrangeGrob(nullGrob(),leg,heights=c(1,10)),
                         tab, nullGrob(), widths=c(6,20,1)),
             heights=c(4,1))
|